
Introduction to Mobile Wind Turbines - Part 2
Preface
This introductory article pair covers the first 6 months of my experience with an Automaxx 400W wind turbine. This series is broken into multiple articles due to length of content covered. Prefer to learn through video content? Check out our YouTube channel here for wind turbine videos and shorts.
Table of Contents
Part 1:
Introduction
Wind Fundamentals
Wind Turbine Basics
Part 2:
Wind Power and Energy
Solar and Wind Hybrid Power
Field Data and Real-World Performance
Wind Power and Energy:
So far, we’ve talked about the fundamentals of wind turbines. We’ve discussed how the wind works as well as the factors that make it so unpredictable and different from sunlight as a source of energy. We’ve also talked about the wind turbine as a machine, including its anatomy and function. Next, we will discuss how the two interact to transform the wind’s energy into electrical power.
How much power is available in the wind?
Let’s first talk solar. The amount of power available from the sun is fairly constant - and I’m not talking about cloud cover or solar tilt angles. I mean the raw power available within the sunlight itself. We can only capture roughly 25% of this raw energy with modern solar technology. The constant nature of solar power makes it very easy to calculate how much energy a solar panel will actually produce.
On the contrary, the raw power available in the wind is highly variable, depending on air density and wind speed. Air density is fairly constant, so we’re more interested in wind speed when determining available wind power. When it comes to harnessing that power, we also have to factor in the efficiency of our wind turbine, as well as the area swept by the turbine blades.
Wind Turbine Power Equation
There is a mathematical equation that describes the power available from the wind for a given wind turbine.
P = ½*ρ*A*Cp*v³
Where:
P is the theoretical wind power available to the turbine
ρ is the air density
A is the swept area of the turbine blades
Cp is the wind turbine efficiency
v³ is the wind speed, cubedThe air density, swept area, and efficiency are all constant values for a given turbine. This means that the power available is directly proportional to the cube of the wind speed. This is described mathematically as follows.
P ∝ v³
So if wind speed doubles from 2mph to 4mph, the power output should theoretically increase by a factor of 2³, or 8 times. In other words, the power available from the wind increases exponentially with wind speed.
As a useful example, 6.5mph is the cut-in speed of the wind turbine, or the speed at which it begins to generate power. if we double that to 13mph, we should theoretically see 8x more power from the wind turbine. In reality, we tend to see ~4-5x more power instead, because of real-world limitations which are not factored into the above equation.
The Betz Limit and real-world efficiency
In the real world, there are many limitations that prevent us from capturing all of the energy available in the wind. Turbulence, inertia/momentum, and electrical and magnetic losses are just a few. There is also something known as Betz’s Law, which defines the maximum theoretical efficiency of a wind turbine.
According to Betz’s Law, the most efficient any wind turbine design can be is 16/27, or 59.3% efficient. This has to do with the wind’s energy and speed. Imagine that some 10mph winds hit a wind turbine, and the wind turbine was able to absorb every ounce of that energy on contact. This would mean that the air exiting the other side of the turbine blades would have no speed at all, preventing any more wind from flowing through the turbine blades and halting all generation of power.
Instead, a sort of equilibrium is required, where the wind turbine slows the incoming winds, but does not completely stop it. This allows the turbine to keep spinning and the air to keep flowing. Betz Law describes this theoretical equilibrium, saying that a wind turbine can take up to 59.3% of the energy available in the wind without impeding the air’s ability to flow through. So efficiency for a wind turbine is not a measure of ‘wasted air’, but just simply a percentage of energy it can take from the wind. This is different from something like fuel efficiency, where the unconverted fuel is truly wasted in an engine as emissions and heat.
A well-designed utility-scale wind turbine might be ~40-45% efficient, which is impressive relative to the current 25% efficiency of most solar panels. Micro wind turbines, however, will achieve something between 10-30% efficiency. Efficiency depends on the turbine design and size; and for most affordable micro wind turbines today, we should expect worse design and smaller size.
Generally, we can expect about 20% efficiency from a decent micro wind turbine, which is comparable to solar efficiency. But again, we must remember that the wind gets its energy from the sun. In fact, only about 2% of the power available in sunlight is transferred to the wind. So overall, wind turbines are going to produce noticeably less power than a solar panel. But don’t worry - what wind lacks in power, it makes up for in energy.
Wind turbine energy - theoretically unlimited runtime
Energy is the cumulative amount of power produced over time. And for solar panels, that energy is limited. Solar panels can’t run for more than an equivalent of ~4.5 hours (PSH - peak sun hours) per day. While the sun is out for much longer than 4.5 hours, PSH approximates the total daily energy produced by a solar panel. Instead of trying to integrate a bell curve of solar generation, just multiply your panel wattage by 4.5 PSH to get the maximum possible energy your panels can produce within 24 hours. And for real world results, derate that value to about 70% to account for inefficiencies, tilt angles, and atmospheric conditions on a sunny day. For a stormy day? Derate to 20-30% - this is what most solar gurus won’t tell you. Solar is not perfect.
But wind turbines? They don’t care how high the sun is in the sky - they produce power as long as the wind is blowing. Sometimes that’s just 30 minutes; other times that’s over 30 hours! This is the magic of wind power, and few people seem to understand it. Because wind is not limited in runtime like solar is, we must consider both wind speed and runtime for daily energy output. Wind speed determines power; runtime determines hours - and they both vary. Multiply the results together within a 24 hour period to get daily Watt-hours of energy. Only with this result can we make accurate comparisons between solar and wind generation.
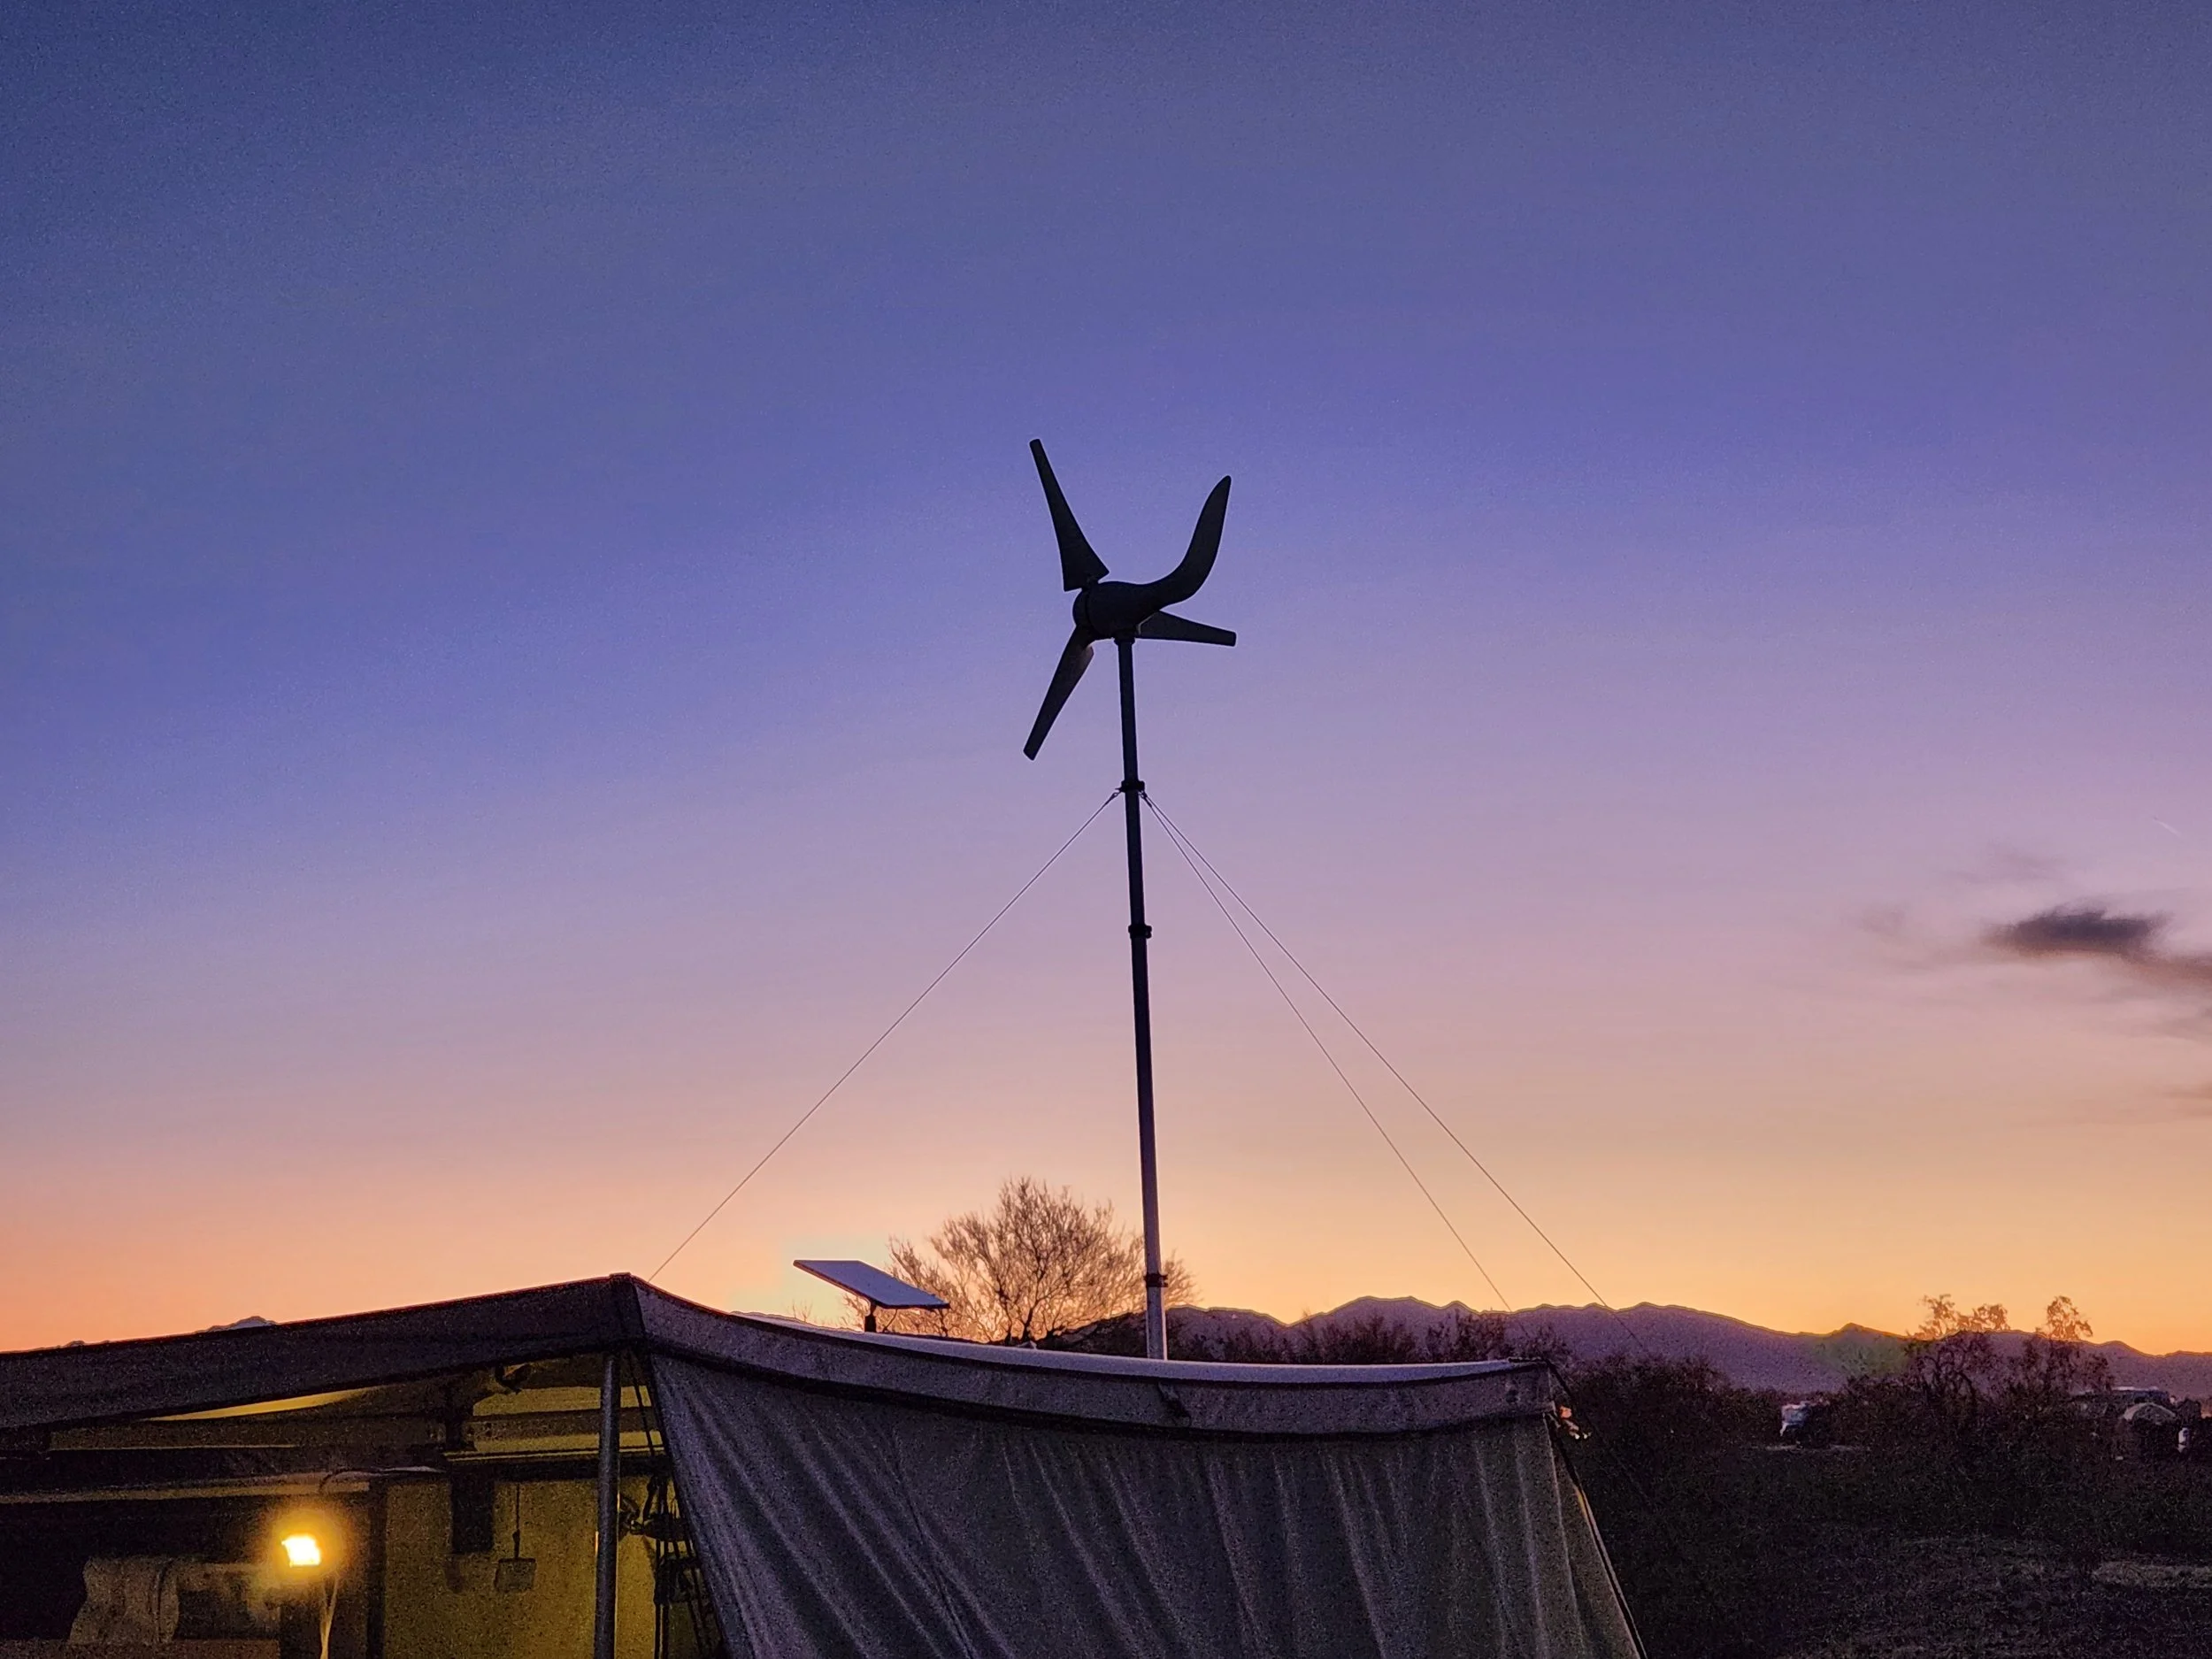
Figure 1: 400W Wind Turbine set up on a mobile rig. A big appeal to these turbines is their ability to generate power in the dark.
Solar VS Wind - Real-world example #1
We haven’t talked about the real-world power generation of wind turbines yet, but now is a good time for a couple examples based on my collected data and experience.
1) On an overcast windy day, a 400W solar array and a 400W wind turbine are both producing power. The solar panels are mounted flat, so we would normally derate their power output by 70%. But since it is overcast, that output is more likely around 40-50% of its maximum rating. We can calculate the daily energy produced by solar as follows.
400W * 40% * 4.5 PSH = 720Wh (min solar energy)
400W * 50% * 4.5 PSH = 900Wh (max solar energy)
On the other hand, the wind was blowing at roughly 12-15mph on average, as measured with an anemometer. our meter showed a consistent 40-50W of power being generated from our wind turbine. Unlike solar, we do not have to derate this value since it is field-gathered data. The wind blew like this around the clock for 24 hours. We can calculate the daily energy produced by our wind turbine as follows.
40W * 24 hours = 960Wh (min wind energy)
50W * 24 hours = 1200Wh (max wind energy)
Despite producing only a fraction of the power produced by solar on an overcast day, the wind turbine actually produced significantly more energy overall - even up to 66% more energy than a solar array of equivalent wattage. This scenario actually happened, and it completely debunks the myth that wind turbines are unreliable.
Solar VS Wind - Real-world example #2
Now, this doesn’t happen all the time. I mean, its not consistently windy for 24 hours straight every day. But 12-15mph winds are common out west, and its not rare for the wind to blow for 24 hours or more. Still, its far more common to experience 4-6 hours of wind at 6-10mph. Its also common for it to be sunny out, so we don’t need strong wind power every single day. So let’s keep this in mind as we look at the next example.
2) On a sunny day with 6-10mph winds blowing for 6 hours, the same solar/wind hybrid power system operates as usual. The wind power is noted to be 15W on average.
Solar: 400W * 70% * 4.5 PSH = 1260Wh
Wind: 15W * 6 hours = 90Wh
This time, the solar panels clearly outperformed the wind turbine, even though it was running for longer. But remember - solar is supposed to produce more energy on a sunny day. This means we don’t need wind power to produce a significant amount of energy every day. We just need enough cumulatively to offset our needs when solar falls short.
Solar and Wind Hybrid Power:
The point of wind power isn’t to compete with solar - its to complement it such that when solar does struggle (and it will), the cumulative energy generated by a wind turbine offsets that loss, so that our batteries never die. No need for fossil fuels, zero reliance on the grid - just free, reliable energy around the clock for 100% electrical independence.
How solar & wind work together
In a typical solar power system, a solar array is sized to provide enough energy to offset the user’s daily energy needs, plus a small buffer to gradually recharge batteries and account for load expansion.
Given a few cloudy days, the batteries will begin to deplete as solar generation falls below the user’s energy demand. When the cloud cover eventually goes away, the solar panels will have to offset the user’s energy demand and recharge the batteries to full. If the solar array was properly sized and the battery bank is nearly depleted, the array will be able to recharge to full within 3-5 days of good sunlight.
The problems occur when those 3-5 days are once again interrupted by more cloud cover. The batteries, which never reached full charge, will continue to drain every day that solar generation is less than energy demand. This cumulative effect of net-negative energy on cloudy days will eventually drain the batteries to zero without a long string of sunny days to completely top off the batteries.
This is where wind power comes into the equation. Solar panels underperform when cloud cover is heavy, which is usually because of a storm front moving through. These storm fronts often cause significant increases in wind speed, which can then be harvested by a wind turbine. So while solar is underperforming, wind can pick up the slack throughout a 24-hour period to keep battery energy levels near full.
Its important to remember that its not always windy when its cloudy. Instead, complex weather patterns can sometimes cause wind to hit before or after the days of heavy cloud cover. This means that we still need to have sufficient battery storage as we would with just pure solar power.
When the wind does hit, the turbine can use that burst of energy to top off the batteries regardless of whether the sun is out or not. And if the sun is out? Then we get the best of both worlds, where solar offsets our daily energy needs, and wind power speeds up the recharging process from 3-5 days to 1-2 days.
Overall, the point is that where solar is predictable and consistent, wind is unpredictable yet persistent. The wind is often strongest in stormy weather, and that happens to be where solar often fails. So while solar and wind aren’t polar opposites of each other, they still reliably keep our batteries topped off rain or shine, day or night.
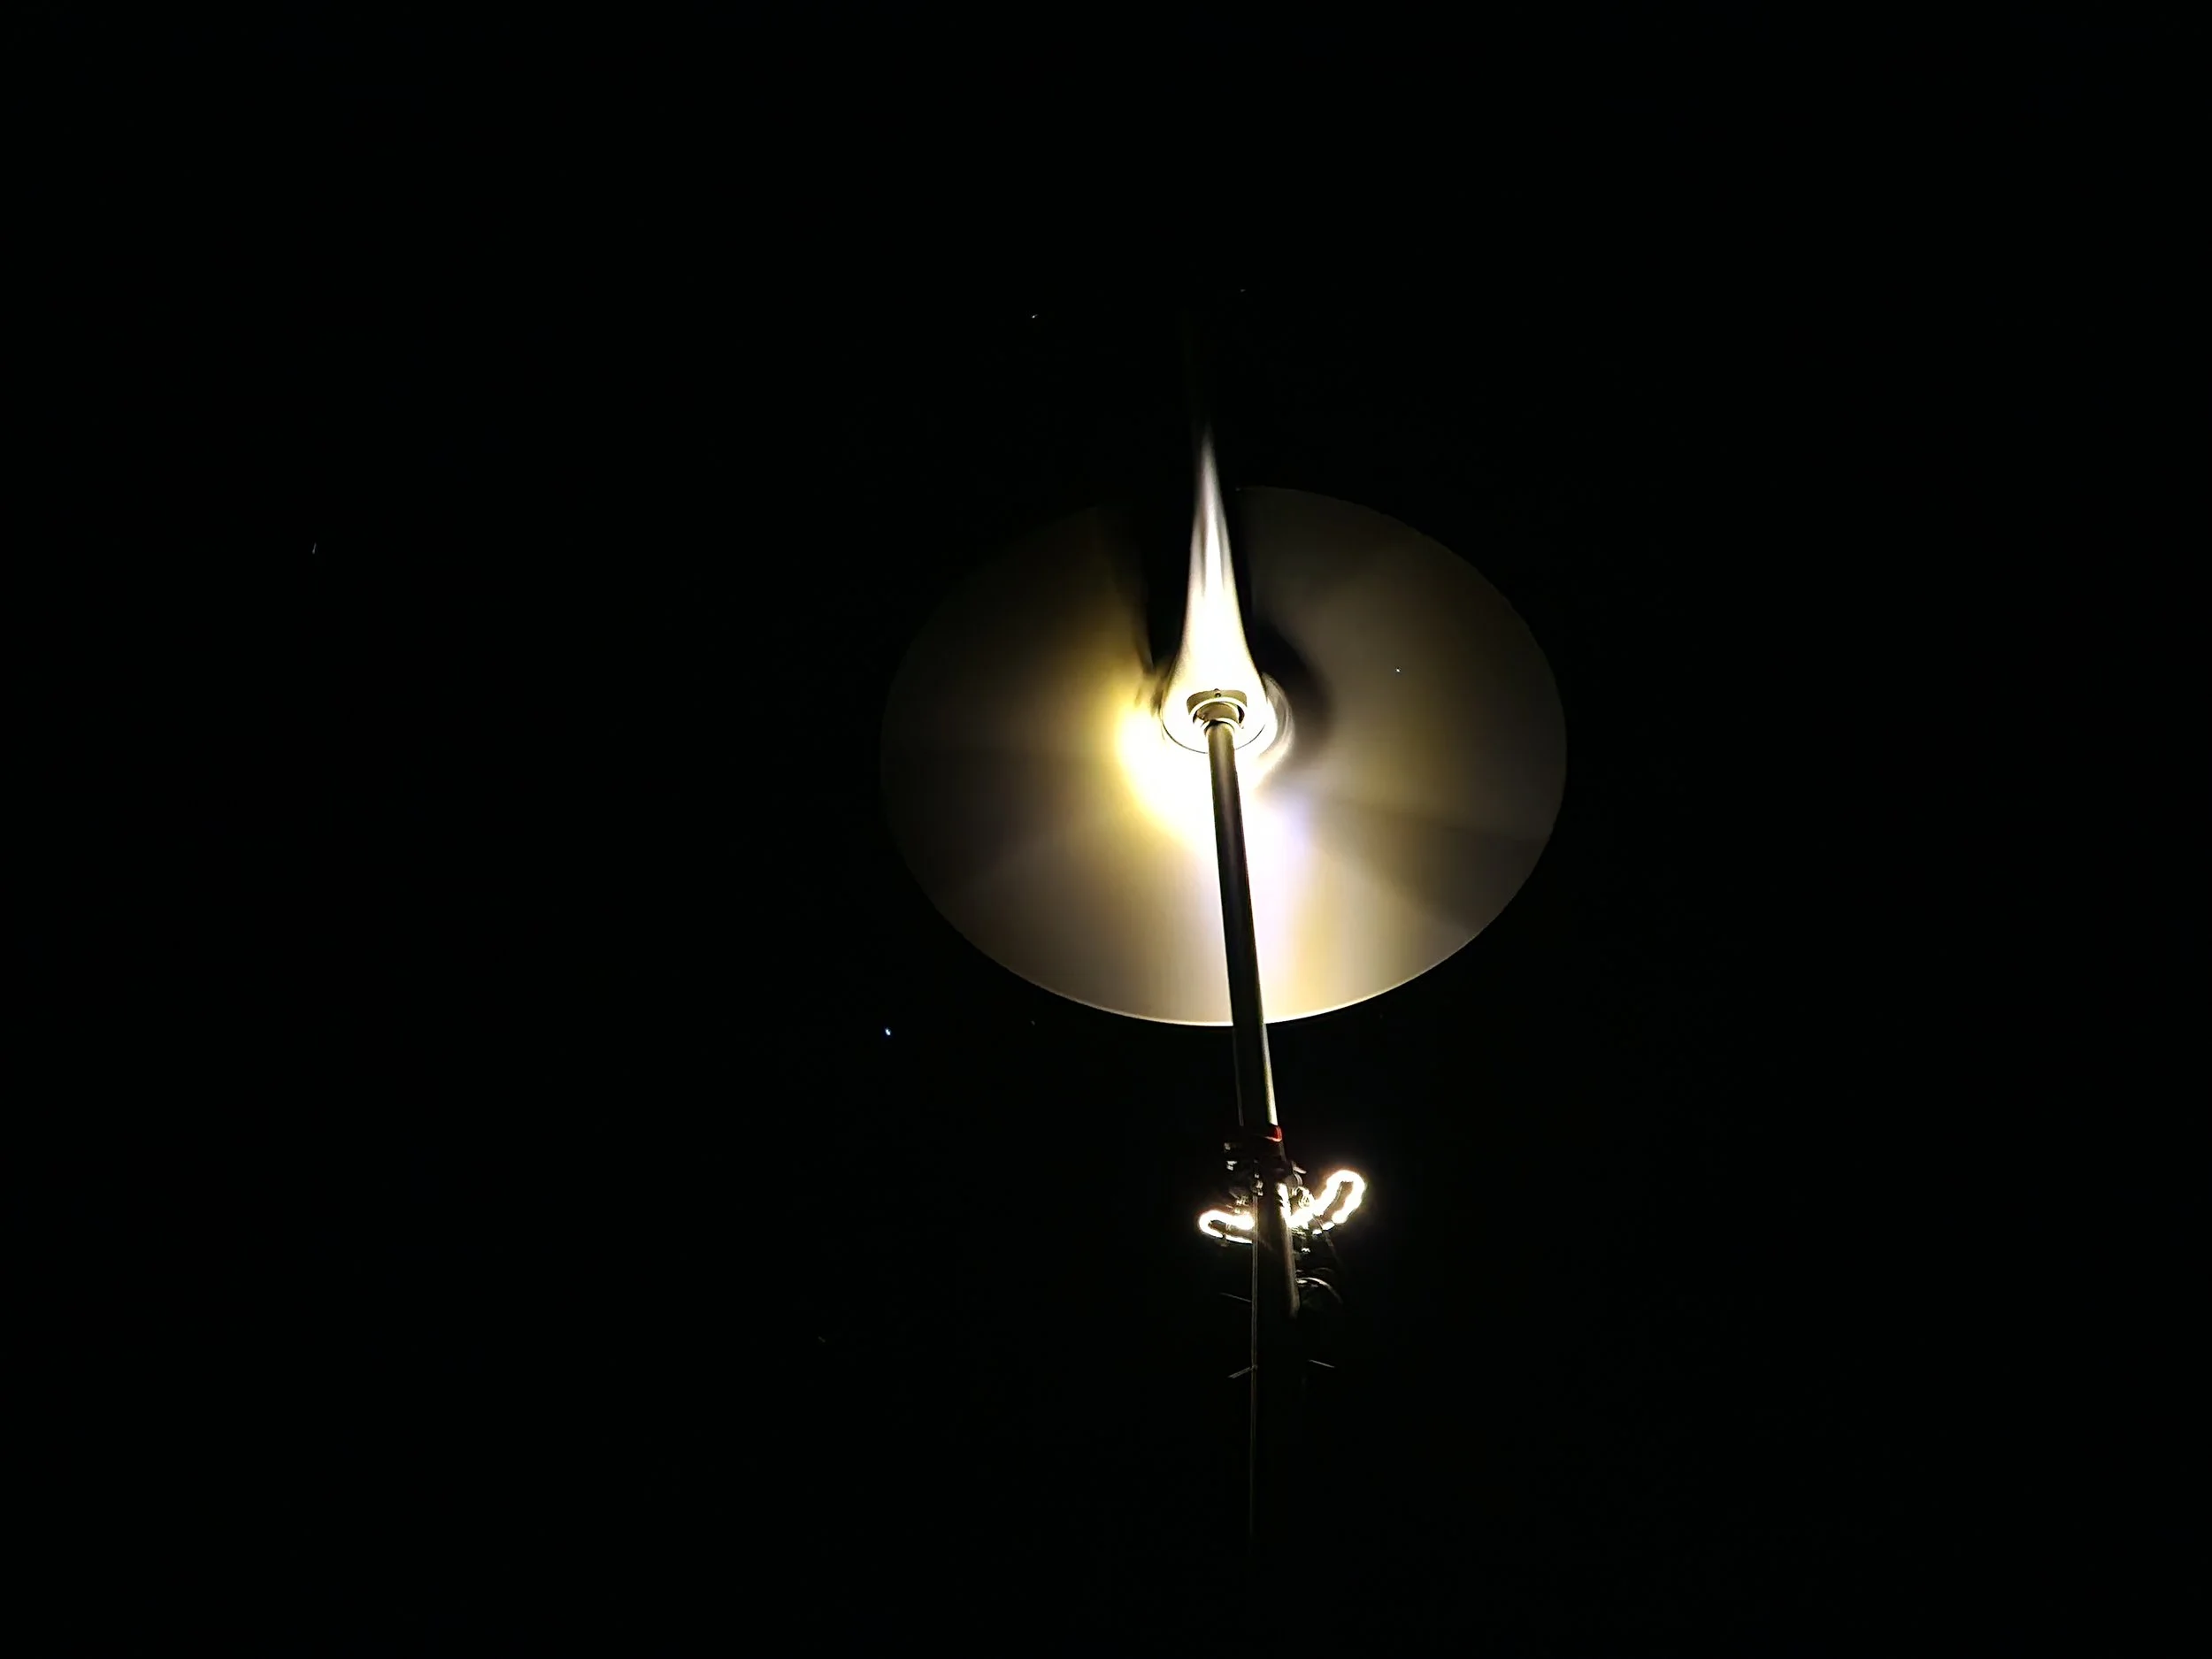
Figure 2: 400W Wind Turbine running at night. The winds were gusting beyond 25mph and the turbine reached a max power output of 150W.
Wind turbines VS overbuilt solar arrays
A common argument against wind turbines is that its easier to just use extra solar panels instead. However, there are a few noteworthy pitfalls that should make us reconsider overbuilt solar arrays.
The primary issue is battery life. Lithium batteries like to sit between 20% and 80% SOC. If they are subjected to 0% or 100% charge every so often, it won’t have much of an effect on battery life. But keeping batteries between 80-100% charge is known to significantly decrease their lifespan. And if we overbuild solar, this is going to happen, since most days are sunny.
While it may sound counterintuitive, the fact that wind turbines don’t run every single day is actually a good thing for our system! This will keep the batteries from reaching full charge too often, adding longevity to the system versus overbuilt solar. And when the turbine is running at full power, we now have 3 options. We can let it run and recharge the batteries if they are depleted. Or if they are full, we can freely use some extra power to recharge devices or run cooling/heating. Or, unlike an overbuilt solar system, we can just choose to turn the turbine off manually. Because its independent from solar, we can have more flexibility and control to protect our system’s longevity.
Regarding DC-DC chargers, shore power, and generators
When it comes to supplementing solar power, most use shore power, generators, or DC-DC chargers. But all of these options rely on fossil fuels, which are limited, subject to inflation, and highly-regulated and controlled. Wind turbines don’t require any fuel, and they’re a one-time purchase with minimal maintenance. But many solar ‘experts’ say that wind turbines are unreliable, listing several myths why they are inferior. So let’s cover each of these common myths to show that wind isn’t just reliable, but that it is actually the better option for supplementing solar power.
Noise levels
The opposition often claims that wind turbines are noisy devices. They say these machines are audible from hundreds of feet away and cause disturbing vibrations that carry through the interior of an RV. But let’s look at the numbers and real-world footage to see the truth.
Portable generators typically produce ~65dB of noise. A running/idling vehicle (required to operate a DC-DC charger) could produce ~80dB of noise outside, although this would appear quieter from inside the vehicle. Compare both of these to a wind turbine, which only produces up to 40dB of noise. Decibels are logarithmic in nature, so a 10dB increase is 10x more intense, and a 20dB increase is 100x more intense. That means wind turbines are over 100x less intense in volume versus a portable generator, and ~10,000x less intense than a running vehicle!
Modern micro wind turbines are quiet, even silent as a whisper from inside of a vehicle with minimal vibration damping. And if you don’t believe it, check out this video here and the clip included below.
Efficiency
What about efficiency? Some claim that wind turbines are one of the least efficient power sources out there. But the data doesn’t support this myth. Portable generators are a very disappointing 13-18% efficient when converting fuel into electricity. Compare this to a vehicle, which may achieve 20-30% efficiency for converting fuel into functional power. And even though the DC-DC charger itself may be more like 80-95% efficient, we have to keep in mind that it’s converting power that was provided from the engine, which again, requires a vehicle that is actively consuming fuel. We discussed earlier that micro wind turbines typically achieve 15-30% efficiency. While this is on par with generator and engine efficiencies, we should remember a few things.
For one, efficiency is a measure of how much power is delivered relative to the amount supplied. Comparing efficiencies of electrical generators that use different sources to produce this electricity is like comparing apples to bricks. Apples are like wind - sustainable, always abundant, regenerative, and natural. Bricks are like fossil fuels - processed, limited, requires energy to even make them, and even harmful in ways. So why are we comparing efficiencies of completely different machines? Why aren’t we focusing on the obvious differences in the source from which they create electricity? Wind is nearly infinite, fossil fuels are not. In that respect, there is infinitely more energy available to mankind from wind than from all the fossil fuels on earth combined.
Additionally, the fuel that isn’t converted in generators and vehicles is wasted as heat and emissions, harming our atmosphere and wasting valuable resources. On the contrary, wind turbines don’t waste any resources. Whatever wind they don’t collect simply passes on as slightly slower wind. Zero emissions, minimal heat waste, and negligible impact to the environment - that’s the real data we should be focused on.
Maintenance
And maintenance? Critics love to say that wind turbines are a bear to maintain. But let’s do a real comparison. Generators need frequent and costly maintenance. Adding fuel, spark plugs, oil changes, air filters, hose leaks, fuel stabilizers - the list goes on and on, and there’s typically something to be done every 24 hours of runtime. Vehicles operating a DC-DC charger don’t need maintenance as frequently, but the costs add up the same. Oil changes, air filters, replacing belts, changing fluids, spark plugs, battery maintenance, alternator replacement, so on and so forth. But wind turbines? These are very simple devices - and I tore mine apart to confirm. The moving parts include a motor with an attached shaft and blades, and two bearings. And all you have to do is replace the bearings every 3-5 years. That’s literally it. No fluids, no fuel, no filters, no serpentine belts. Just two bearings once every 3-5 years, which is a 30-minute job with the right tools.
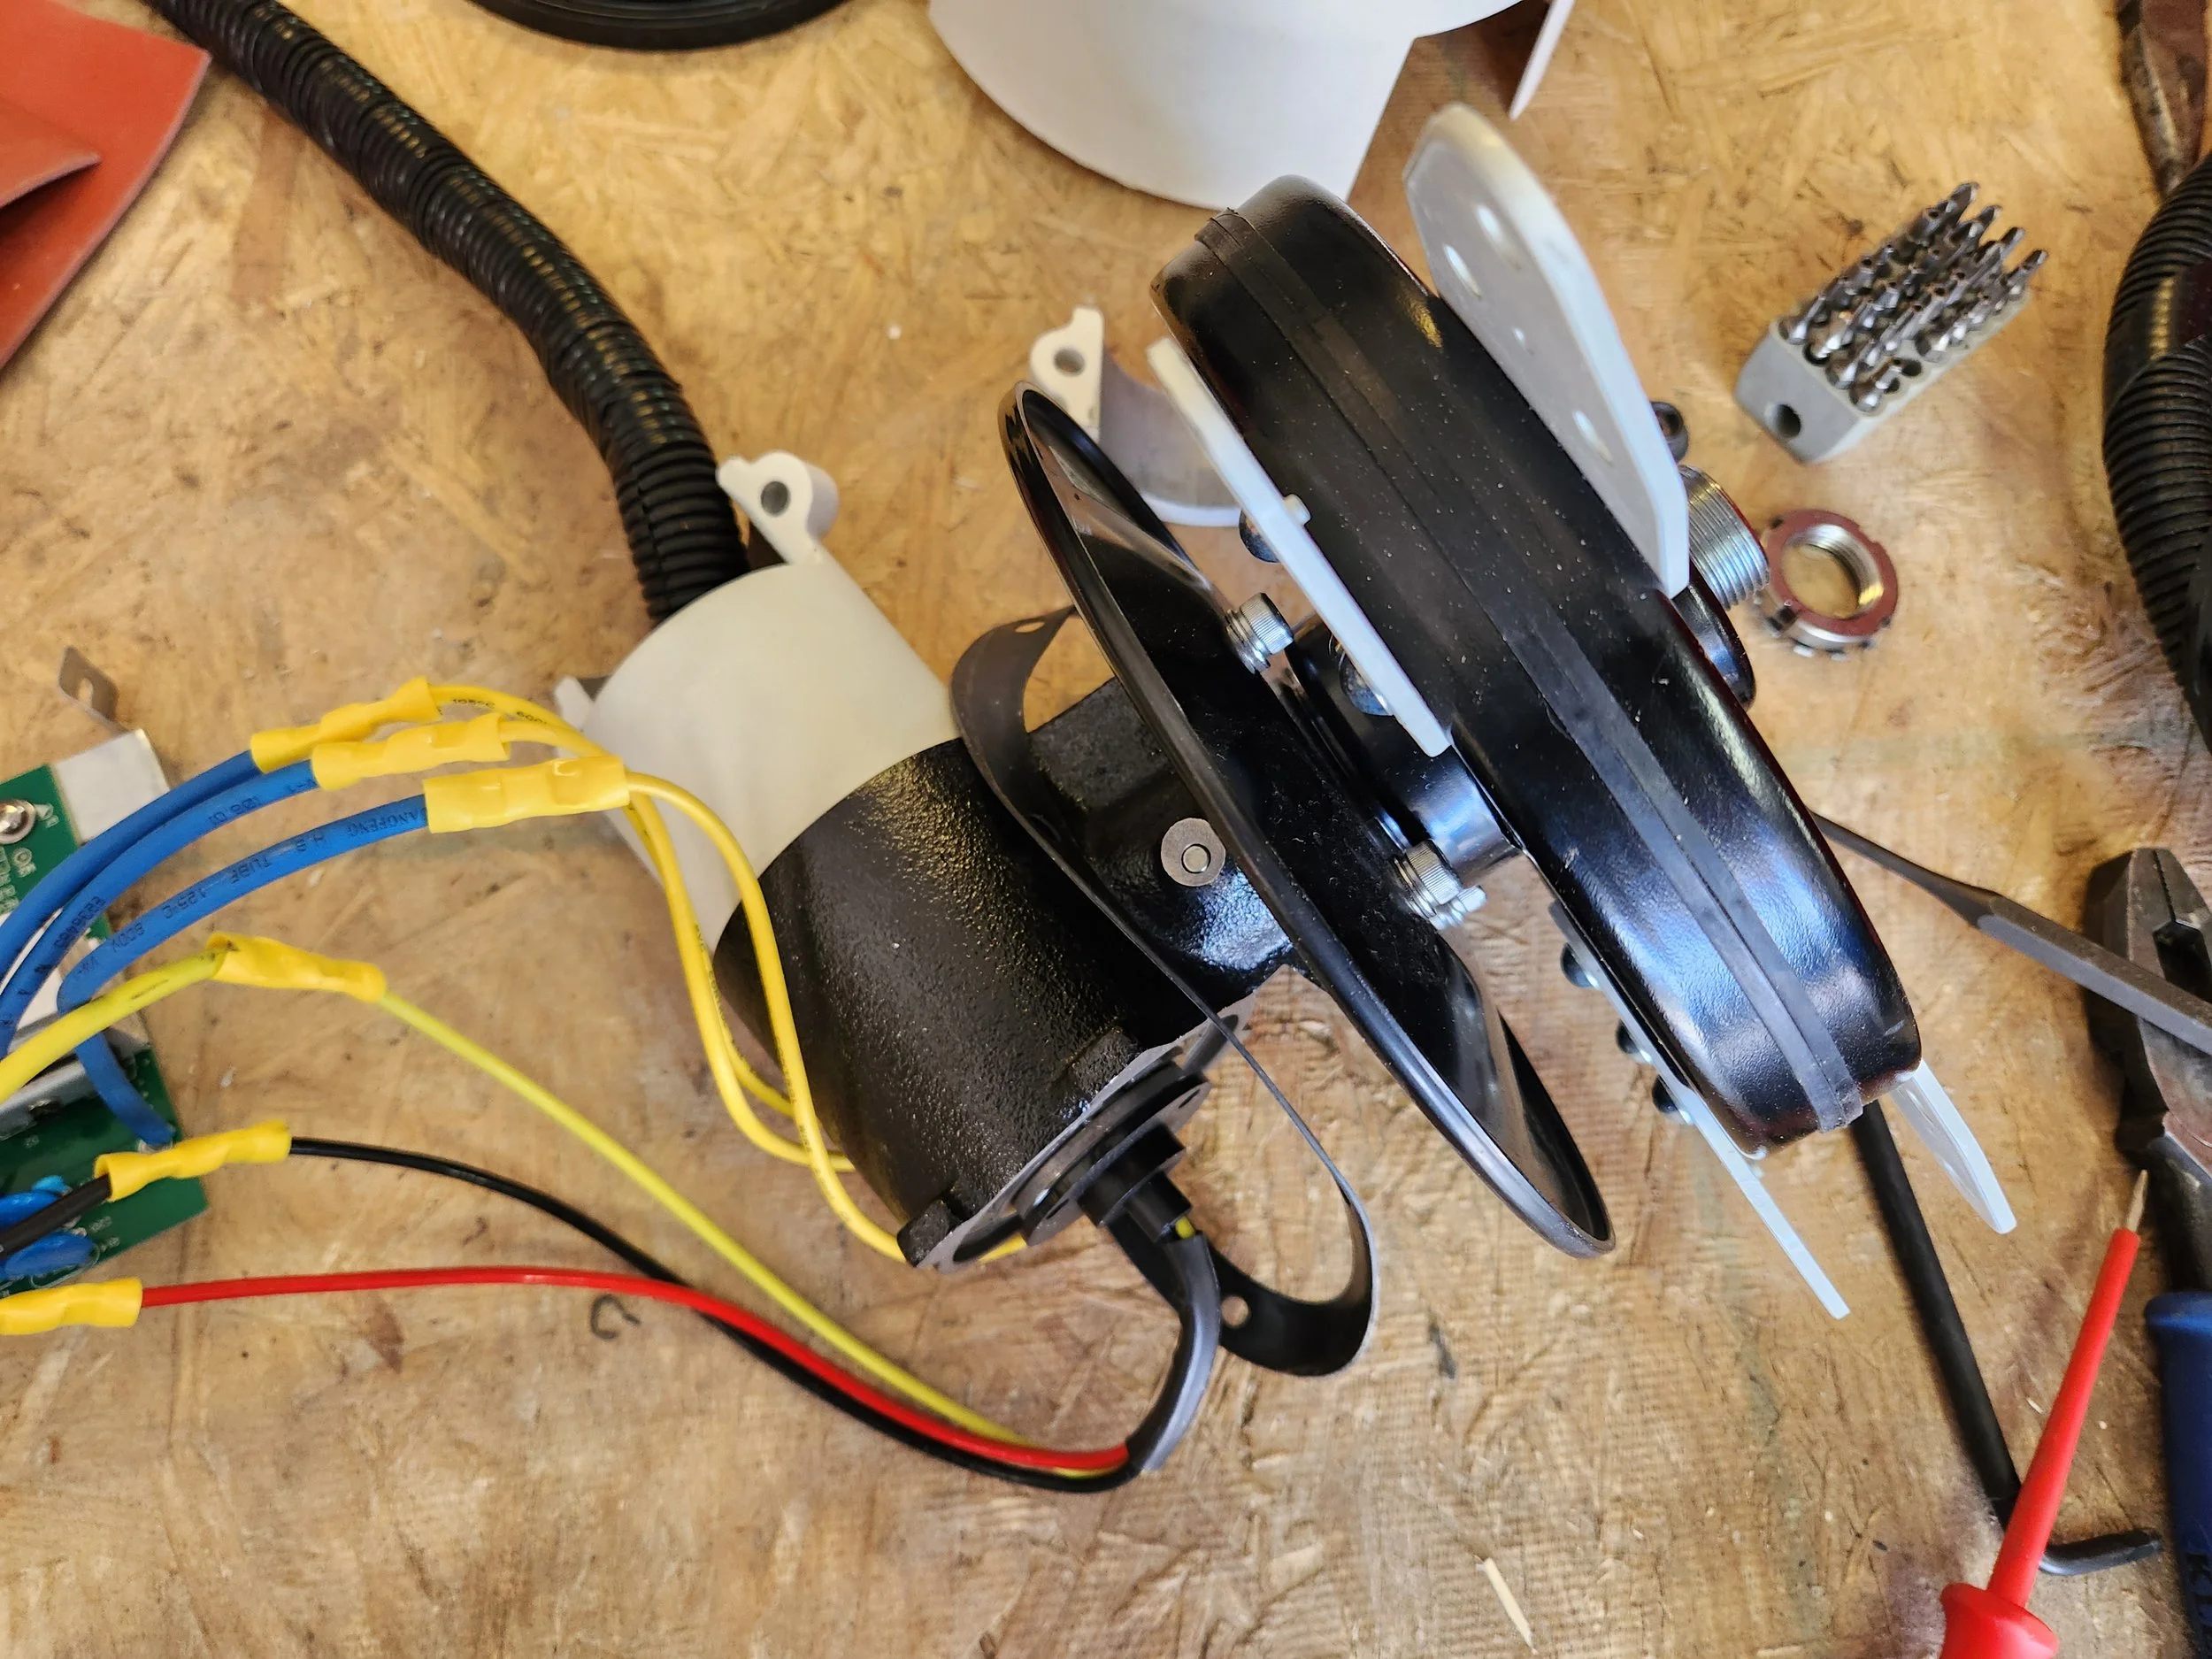
Figure 3: 400W micro wind turbine with the plastic housing removed. From left to right is the wind charger PCB, input and output cables, the motor, and the hub with bearings that connects the shaft to the blades. Besides the hub bearing, there is also a yaw bearing that allows the turbine to spin freely into the wind. The hub and yaw bearings are the only two components that need to be replaced every 3-5 years.
Cost
The real eye-opener is cost. Is $1,200 for a complete turbine kit really a big deal? The critics like to say so, but let’s compare. That $1,200 investment lasts 5 years before the first maintenance is needed. A DC-DC charger may only cost ~$150 initially. But the vehicle running it may need 10-20 oil changes every 5 years, which is easily $1,000-$2,000 in professional costs. And that’s ignoring everything else - gas, air filters, belts, tire rotations, etc. A portable generator for RV use typically costs $400 for a super cheap one, or $1,000+ for a quality unit. But the cheap options won’t last more than 2-3 years, and the expensive ones chug fuel like hogs. Estimating an average fuel consumption of 100 gallons per year for moderate camping use, that’s over $2k in fuel costs alone in today’s economy! And that’s just considering a single year - not 5. $1,200 for wind power is really starting to sound like a winner to me, and the ROI is just insane!
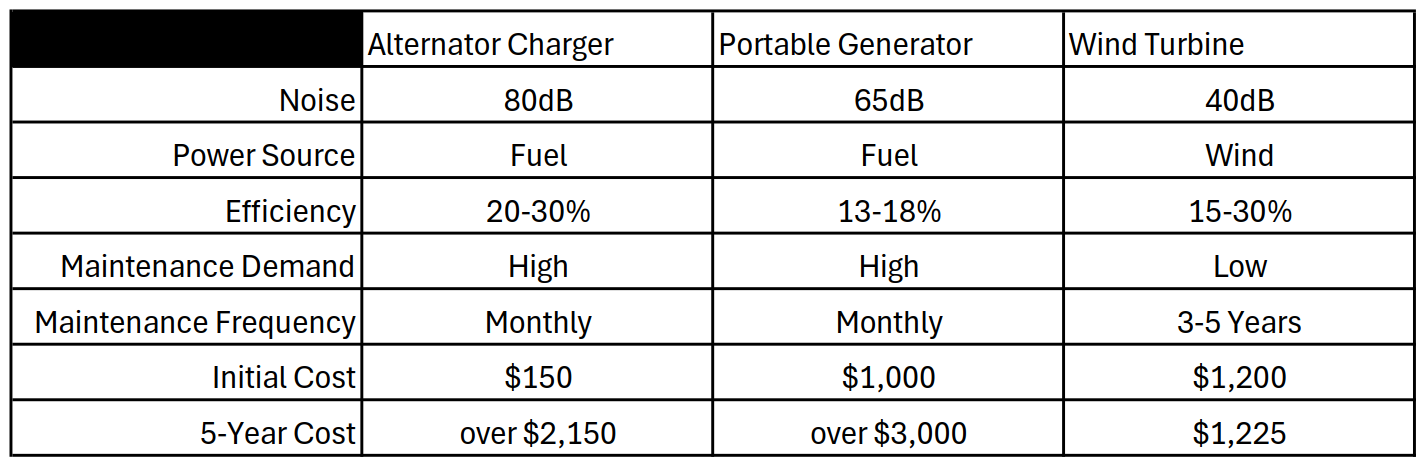
Figure 4: Solar Alternatives - Comparison Table
Cases where wind outperforms the competition
There are a few situations in which wind power really stands out against all of the alternative options. Let’s take a quick look at a few examples.
#1 You’re stuck in a snowstorm, which covers your solar panels. Your batteries only have enough energy storage for 1-2 days of use with your electric heater and other loads. But with the wind turbine spinning hard in those extreme conditions, you can survive for 3-4 days while using extra heat until the snow stops, allowing you to clean off your snow-covered panels after the fact for quick recovery.
#2 You are parked in a forested area or inside a canyon, and solar performance isn’t keeping up due to extended panel shading in the mornings and evenings. However, because of geography, the wind is often strong in that area. The wind turbine makes up for the solar energy deficit, allowing you to camp out for weeks without your batteries gradually dying.
#3 You are parked in Quartzsite, AZ surrounded by a bunch of other campers. Quiet hours are 9pm-6am, so you can’t use your diesel generator to power your heater on those chilly winter nights. Luckily, Quartzsite is consistently windy in the winter. So you set up your wind turbine to bridge the gap, allowing you to use the heater during those colder nights without disturbing your neighbors from the noise.
#4 Gas prices have been rising dramatically, so you avoid driving as much to save money. However, you had been relying on a DC-DC charger to provide the bulk of your power, because your van roof just doesn’t have much space for enough solar panels. You set up your wind turbine instead since it doesn’t take up any extra roof surface area, and are able to camp for extended stays without spending money on gas.
Eventually, the economy collapses and gasoline becomes impossible to obtain. With the wind turbine plus solar power, you can survive as long as you want in the forest near a river, fishing and foraging for food, filtering water with your electric filter, cooking with your electric hot plate, and just waiting out the chaos in peace as the world around you struggles. Because you knew the truth all along - 100% electrical sovereignty is freedom in a collapsing world.
Field Data and Real-World Performance
Wind turbine performance depends on power generation relative to wind speed. In an ideal world, we’d get power proportional to the cube of the wind speed, multiplied by the Betz limit (59.3%). This was explained in the beginning of this article, where we analyzed the wind power equation.
But real-world factors and limitations reduce actual power generation; and we need to know these numbers to determine actual energy generation capabilities. This is one of the main reasons why I bought my turbine - to test real-world performance versus manufacturer-provided data.
So what have been my observations after running a wind turbine in various wind speeds and different geographies? In short, the manufacturer-provided data for my turbine significantly overestimates real-world results. Their result are technically achievable in a lab setting with perfectly laminar winds, a perfectly-matched variable load bank, and perfect mounting without any movement in high wind speeds. But this is not helpful whatsoever to most real-world applications.
This is where most turbine users get discouraged and give up on wind power. But my experience shows that evenreal-world performance is still more than enough. Recall the examples from earlier - even just 40W of power over a 24-hour period can easily provide more energy than a 400W solar panel in stormy conditions. In my field testing, I’ve recorded power up to 150W so far. And that's with suboptimal mounting, imperfect wiring, turbulence and wind gusts, and other nonideal factors at play. If the wind were strong enough to sustain that 150W of power for 24 hours? that would be 3600Wh - enough to completely recharge my 12V 300Ah battery bank from empty, without solar, in a single day. The data shows this is possible; and there is still room for growth as I continue to optimize my turbine mounting structure. So let’s take a look at what I have documented so far, and the factors that visibly affect these results.
real-world complications - turbulence, gusts, mounting, and obstructions
In a wind tunnel for testing turbines, the wind is perfectly laminar with zero turbulence, gusts, or obstructions. But in the real world, we get the opposite. Turbulence turns linear airflow into chaos, pushing on a turbine from multiple directions. Wind Gusts add to the chaos, with highly inconsistent wind speeds that subject the turbine to strong impulses and constant inertial forces. Obstructions like tree cover or even the mounting RV itself reduce localized wind speeds and force the wind to approach from different angles instead of head-on. And the mounting structure which holds the turbine up only adds to the complications with mounting height, stability, and the need of being perfectly level.
The biggest thing to understand is that all of these factors affect power levels; which implies that the data I have collected isn’t going to be 100% accurate for every single case. Its through consistency in my measurements that I feel confident in the data I have collected thus far. But again, as I continuously improve my mounting structure and techniques, it is likely that I will begin to collect even more power from the same wind speeds. So take this data with a grain of salt, knowing that there will be variation depending on wind conditions, mounting structure, and the model of turbine used.
The Manufacturer-provided Data
There are several wind turbine manufacturers out there, but only some of them publish their performance data. The Automaxx website from which I purchased my turbine has images for the estimated performance of each of their models. For example, you can scroll through the images provided in this link to see the 400W turbine power curve - and similarly for their other models.
This data is obviously high compared to the field data I have collected - but again, I believe this is because they collected this data in a lab setting, not the real world. On the contrary, another UK manufacturer provided data for their own turbine here. This turbine is roughly the same size as mine, and the data aligns more closely for real-world performance. I would actually prefer to have this turbine since it is compatible with Lithium batteries without risk of overcharging them, but it’s also over twice the price of the one I own.
Automaxx Turbine Comparison
Out of curiosity, I extracted the manufacturer-provided data to plot the power curves of their two smaller turbines against each other. And the results are pretty interesting.
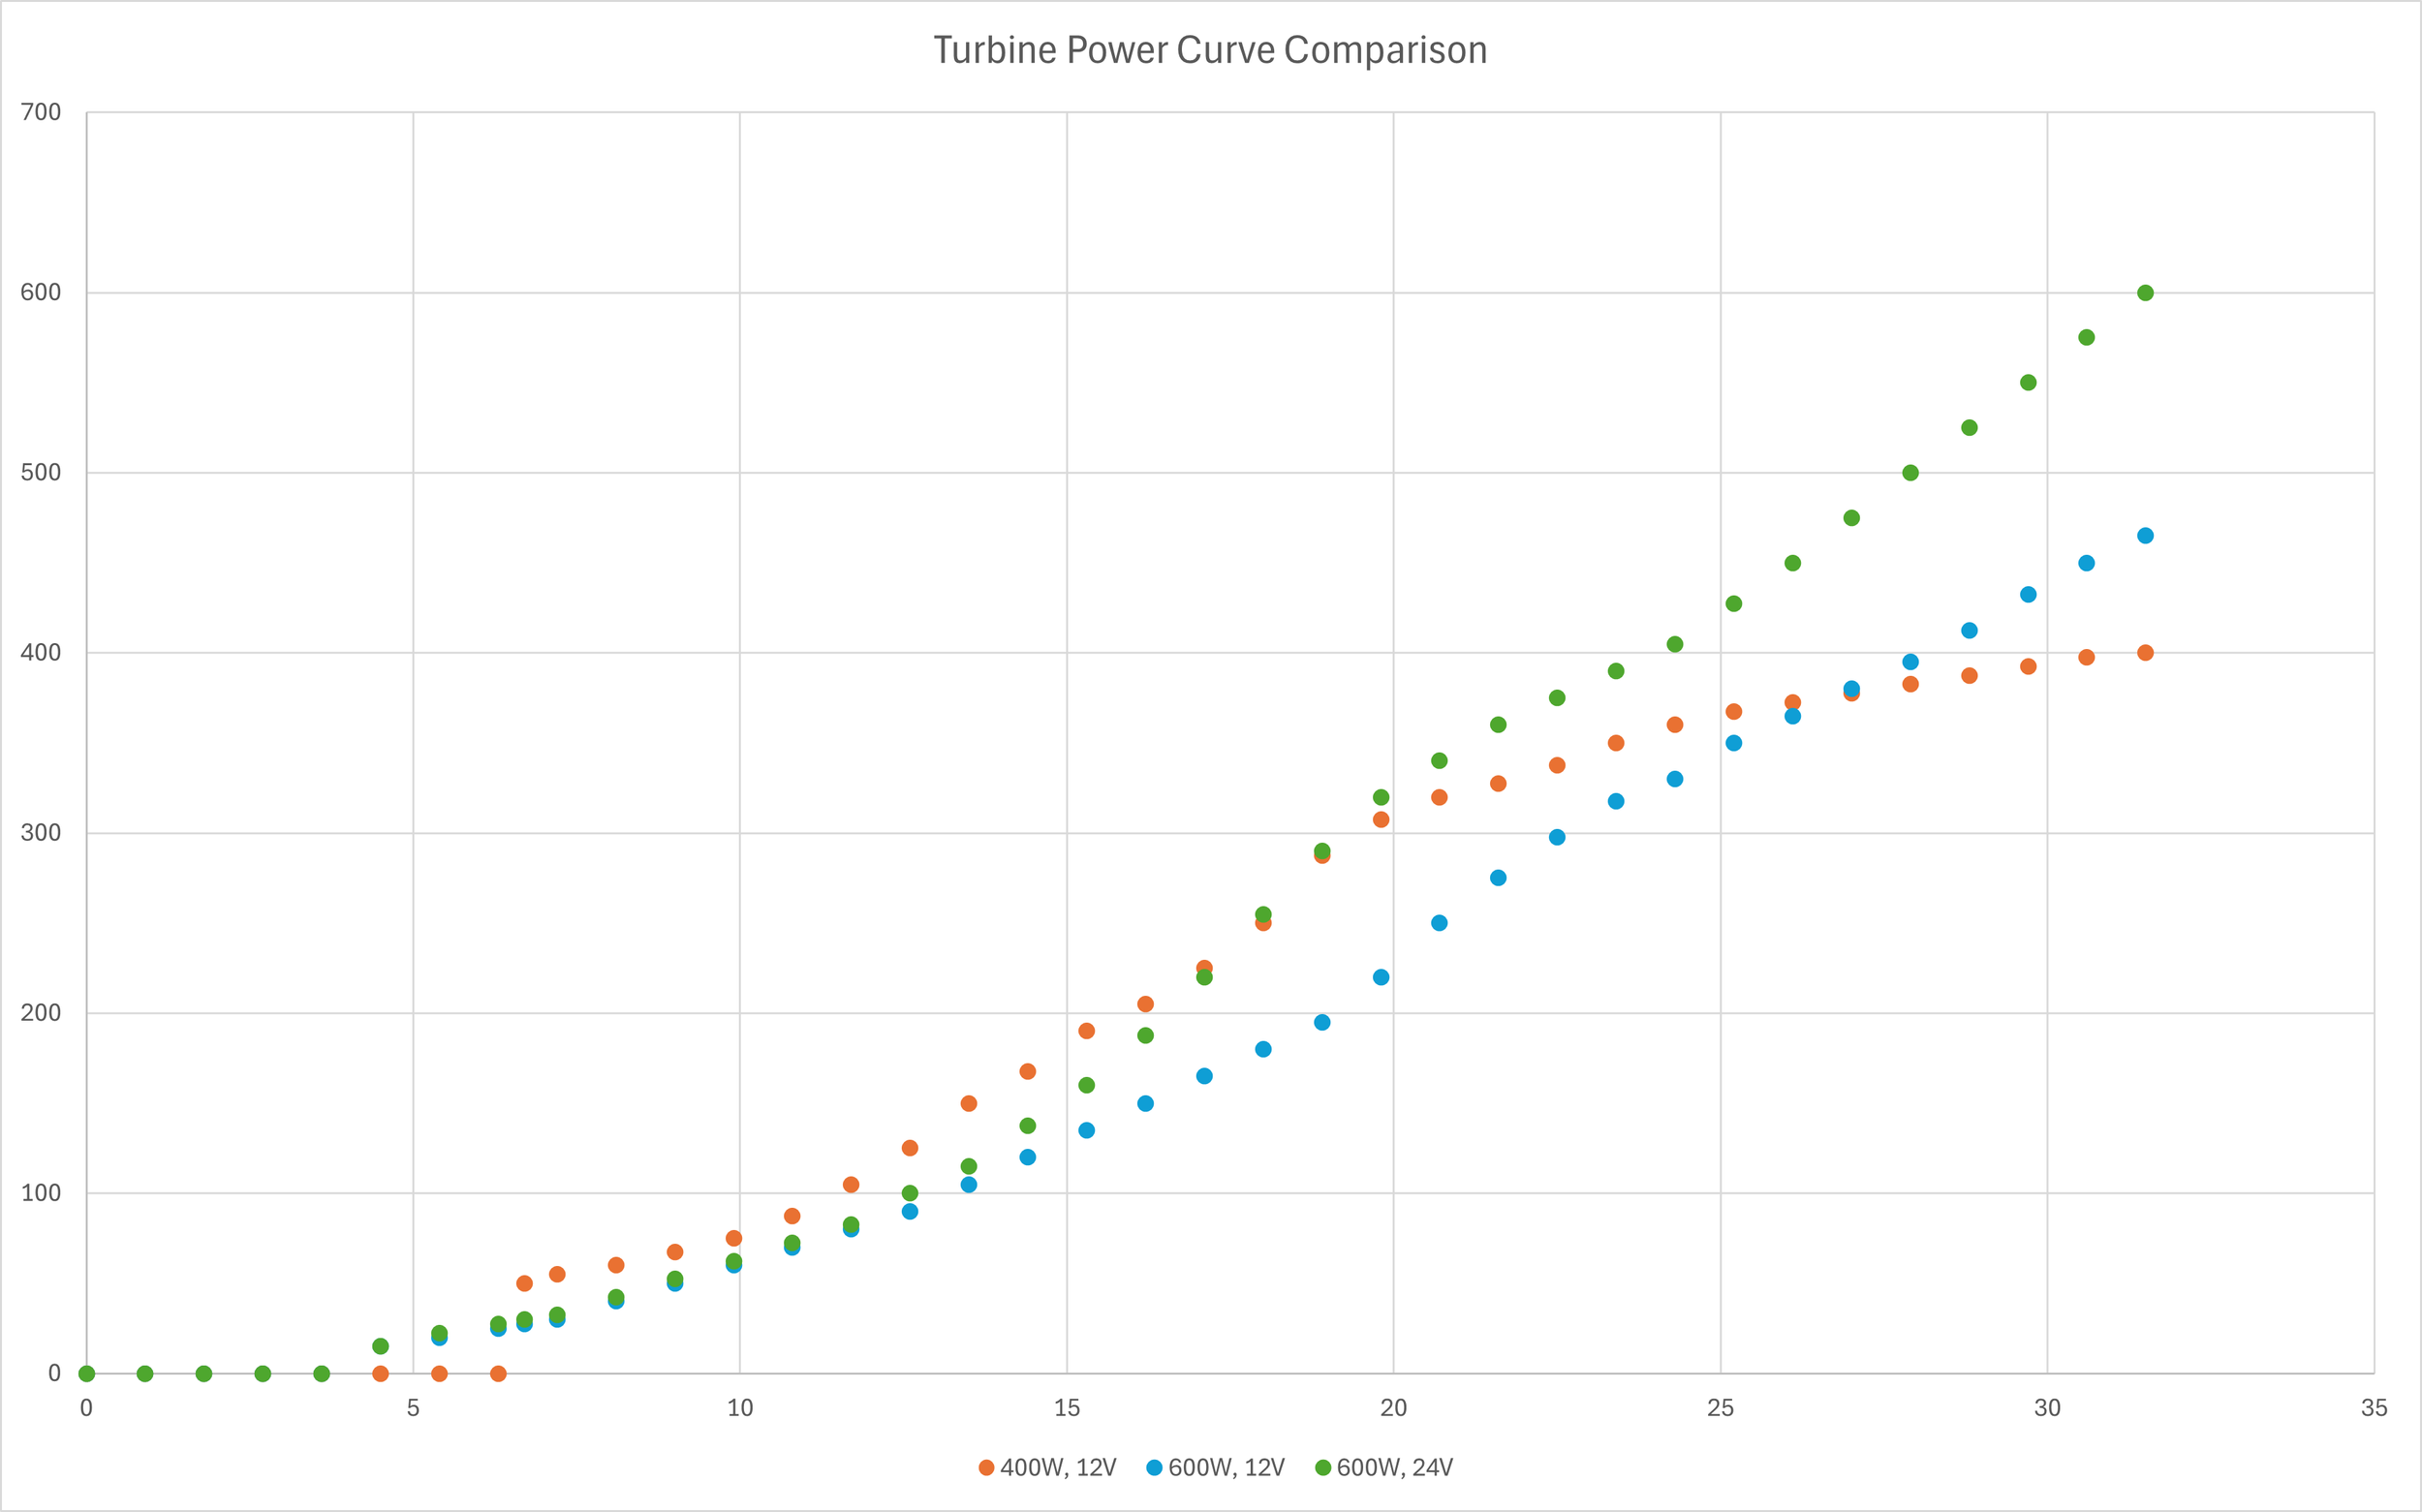
Figure 5: Automaxx Wind Turbine Power Curve Comparison. X-axis: Wind Speed (mph), Y-axis: Power (W). (orange) 400W 12V wind turbine like the one I have. (blue) 600W 12V wind turbine. (green) 600W 24V wind turbine.
I was initially surprised to see that, at 12V, the 400W wind turbine actually outperforms the 600W turbine until winds reach about 27mph. But after thinking for awhile, I realized this makes perfect sense. A 600W wind turbine may have bigger blades, but it also has more mass. And thanks to inertia, more mass is going to take more energy from wind to spin the blades and produce power! That means these bigger turbines are actually worse for RV applications, since wind speeds are more likely going to be around 10-15mph on average.
Even at 24V, the 600W wind turbine still doesn’t outperform the 400W turbine until about 18mph wind speeds. So why would you want a bigger turbine? I would think that if you planned to set up such a turbine somewhere permanently like in Alaska or Wyoming, you might expect consistently stronger winds and thus want a bigger turbine to capture that. But RVs are always on the move, and we don’t always find ourselves in highly-windy environments. So smaller is typically better for mobile wind turbines - which is contrary to how most people approach solar design!
The Field Data
Below I’ve included the data on average power levels that I see for a given wind speed. Note that, due to inconsistent wind speeds in the field, it is difficult to pin a specific power rating to a specific wind speed. Instead, these values are close approximations based on the range of wind speeds I gathered the data at, and the consistent power rating I saw at those speeds. And again, real-world complications will add to the variance of field performance.
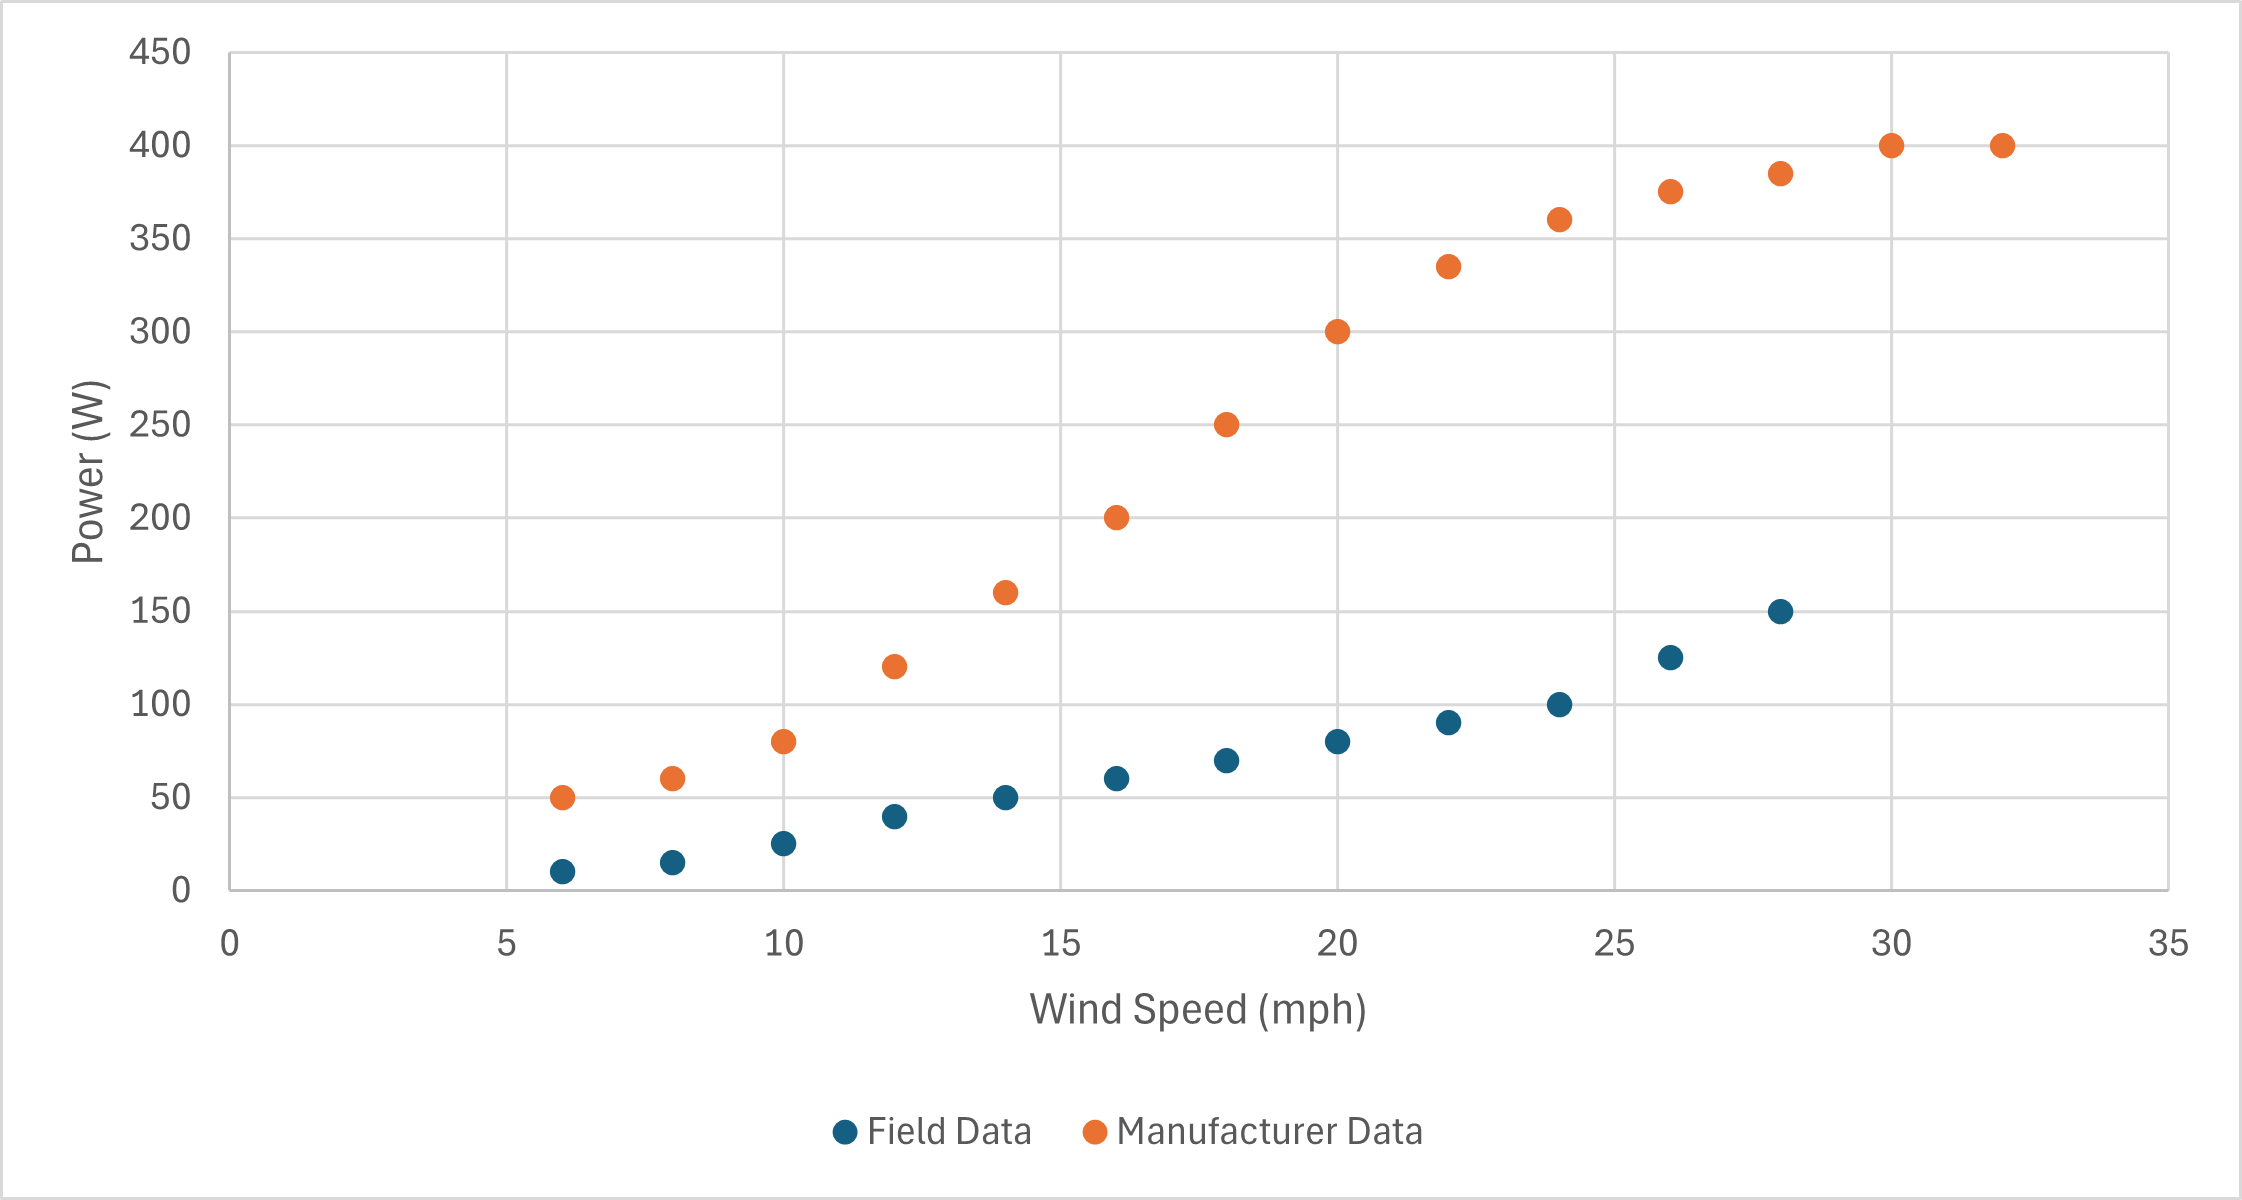
Figure 6: Plot of Wind Turbine Field Data VS Manufacturer-Provided Data. Field performance is noticeably lower than what the manufacturer quotes.
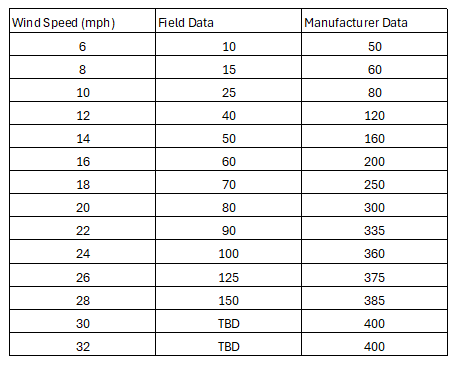
Figure 7: Table of Wind Turbine Field Data VS Manufacturer-Provided Data. Data collected at 30+mph has not been consistent enough for reliability.
As you can see, actual power output is typically about 3-4x lower than what the manufacturer specifies. At higher wind speeds, its also more difficult to pin down a specific power output value to a given wind speed. These higher winds tend to be much more chaotic with sudden gusts that can throw off measurements.
I’ve actually pushed the turbine up to 40mph winds (as measured with my anemometer), but have not gotten reliable measurements from those speeds yet. I suspect that a few things are going on. #1 my anemometer may be overestimating wind speed. #2 the real-world power curve of my turbine may just be stretched out over a longer range of wind speeds, so perhaps at something like 50mph I may actually get my desired 400W rated value. #3 my mounting structure is not perfect, so stronger winds can cause vibrations and such that prevent the turbine from spinning as smoothly as desired.
There are probably more culprits involved, but thus far, I am happy with the results. I will continue to test this turbine and make improvements where I can to maximize power output and gather some more comprehensive data. That’s the nature of innovating where few others have gone before.